Objective
Bring the excitement of going to a sporting event in-person to the comfort of your own home! Using a Raspberry Pi connected to a 64x32 LED matrix, this miniature scoreboard pulls and displays live sports scores from the ESPN API. The scoreboard allows the user to select from many sports and teams, both collegiate and professional, using the built-in PiTFT touch screen. The scoreboard displays pre-game information, in-game scores, and post-game results.
Introduction
This project emulates a scoreboard by using a Raspberry Pi connected to a 64x32 LED matrix. Using
the touch
screen on the PiTFT, the user is able to select a team to display from collegiate and professional
hockey,
football, and basketball. The user can also
select to rotate between teams instead of displaying only one team. The system then queries the ESPN
API to
get live scores from the internet according
to the user's settings. Finally, the team names, logos, and scores are displayed on the LED matrix.
The
scoreboard displays a celebration whenever a team scores in Football or Hockey.
When the selected team is not currently in a live game, the scoreboard displays the results of the
previous
game or the date, time, and opponent of the next game, depending on which is closer in time. Using
cron, the service starts on boot and defaults to displaying Cornell Men's Hockey.
Demo Video
Design & Testing
Hardware Design and Testing
As seen in Figure 1, the hardware consists of three major components: a Raspberry Pi 4, a touchscreen PiTFT, and a 64x32 LED Matrix. The Raspberry Pi contains a 16 GB SD card with the Lab 3 kernel installed, and is connected to power and the PiTFT in the same way as in Lab 3. The LED Matrix requires an additional 13 GPIOs to connect, fortunately none of which conflict with the PiTFT. To power the LED Matrix, the included Power and Ground connector cable gets plugged into the back of the LED matrix on one end and screwed into a Female DC Power adapter on the other. Finally, the DC power adapter is plugged into a 5V 2A power cable.
Figure 1: System Overview
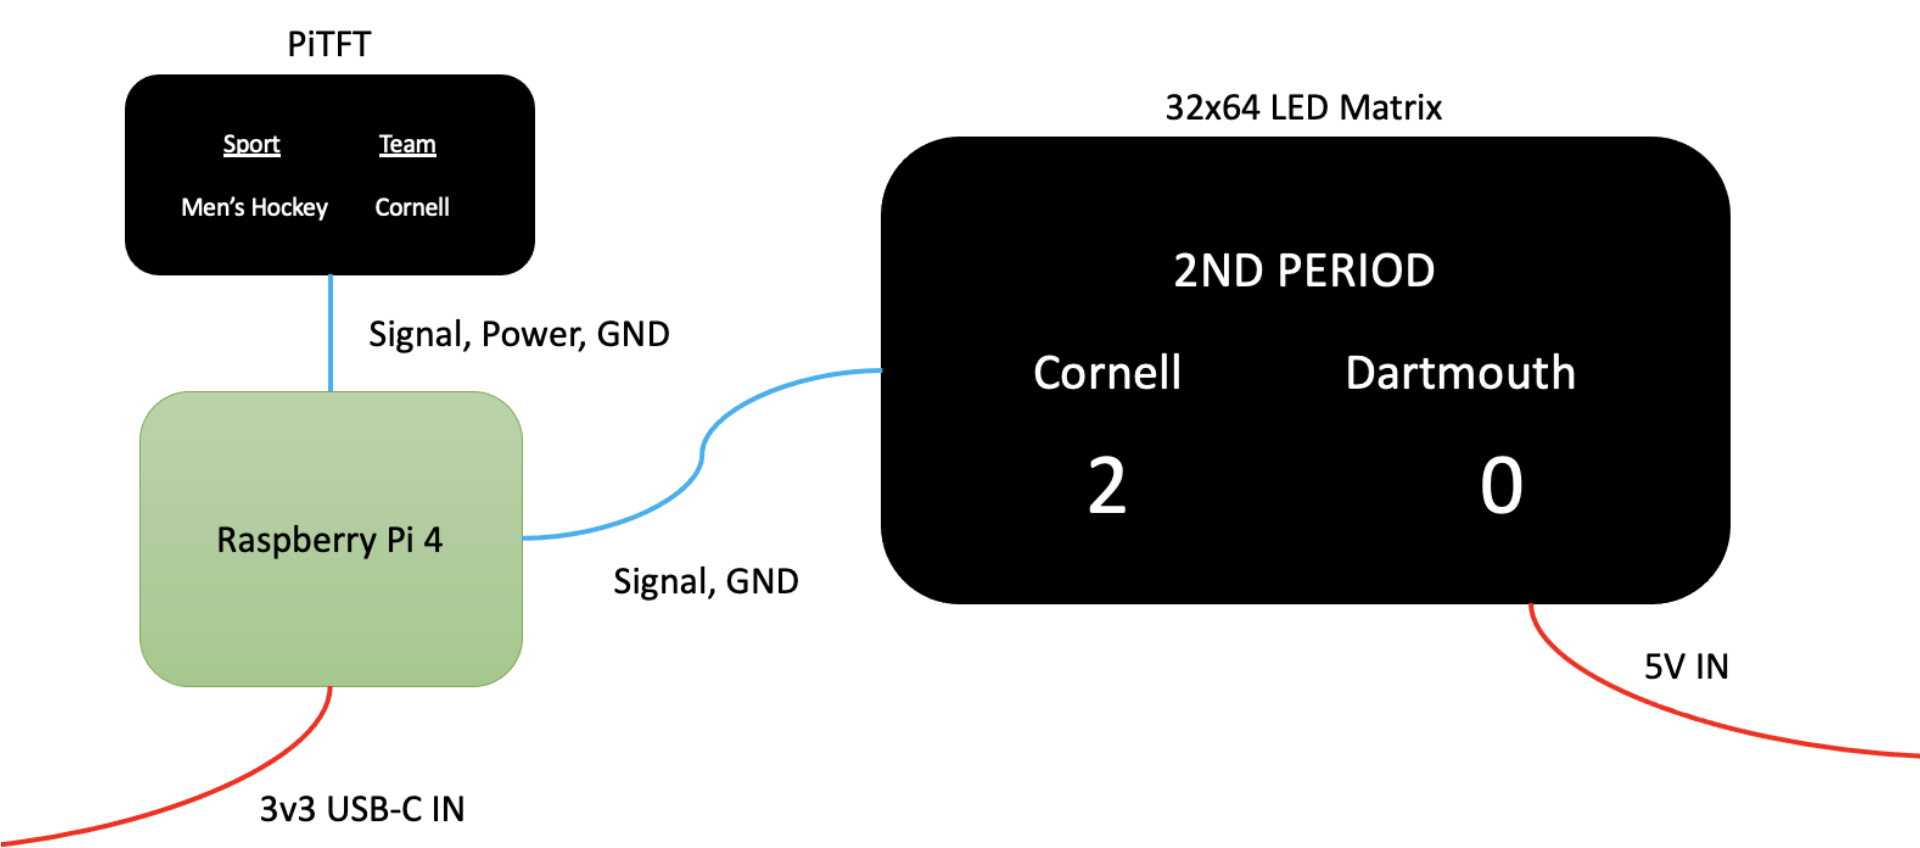
Table 1 shows the correct pinout for connecting the LED Matrix to the Raspberry Pi [1]. LED Matrix pins are numbered left to right, top to bottom.
Table 1: Raspberry Pi to LED Matrix Wiring
| Pi Pin | Matrix Pin | Signal Name |
|---|---|---|
| GPIO 5 | 1 | Red Row 1 |
| GPIO 13 | 2 | Green Row 1 |
| GPIO 6 | 3 | Blue Row 1 |
| GPIO 12 | 5 | Red Row 2 |
| GPIO 16 | 6 | Green Row 2 |
| GPIO 23 | 7 | Blue Row 2 |
| GPIO 22 | 9 | Line Selection A |
| GPIO 26 | 10 | Line Selection B |
| GPIO 27 | 11 | Line Selection C |
| GPIO 20 | 12 | Line Selection D |
| GPIO 17 | 13 | CLK |
| GPIO 21 | 14 | Latch |
| GPIO 4 | 15 | Output Enable |
| GND | 4, 8, 16 | GND |
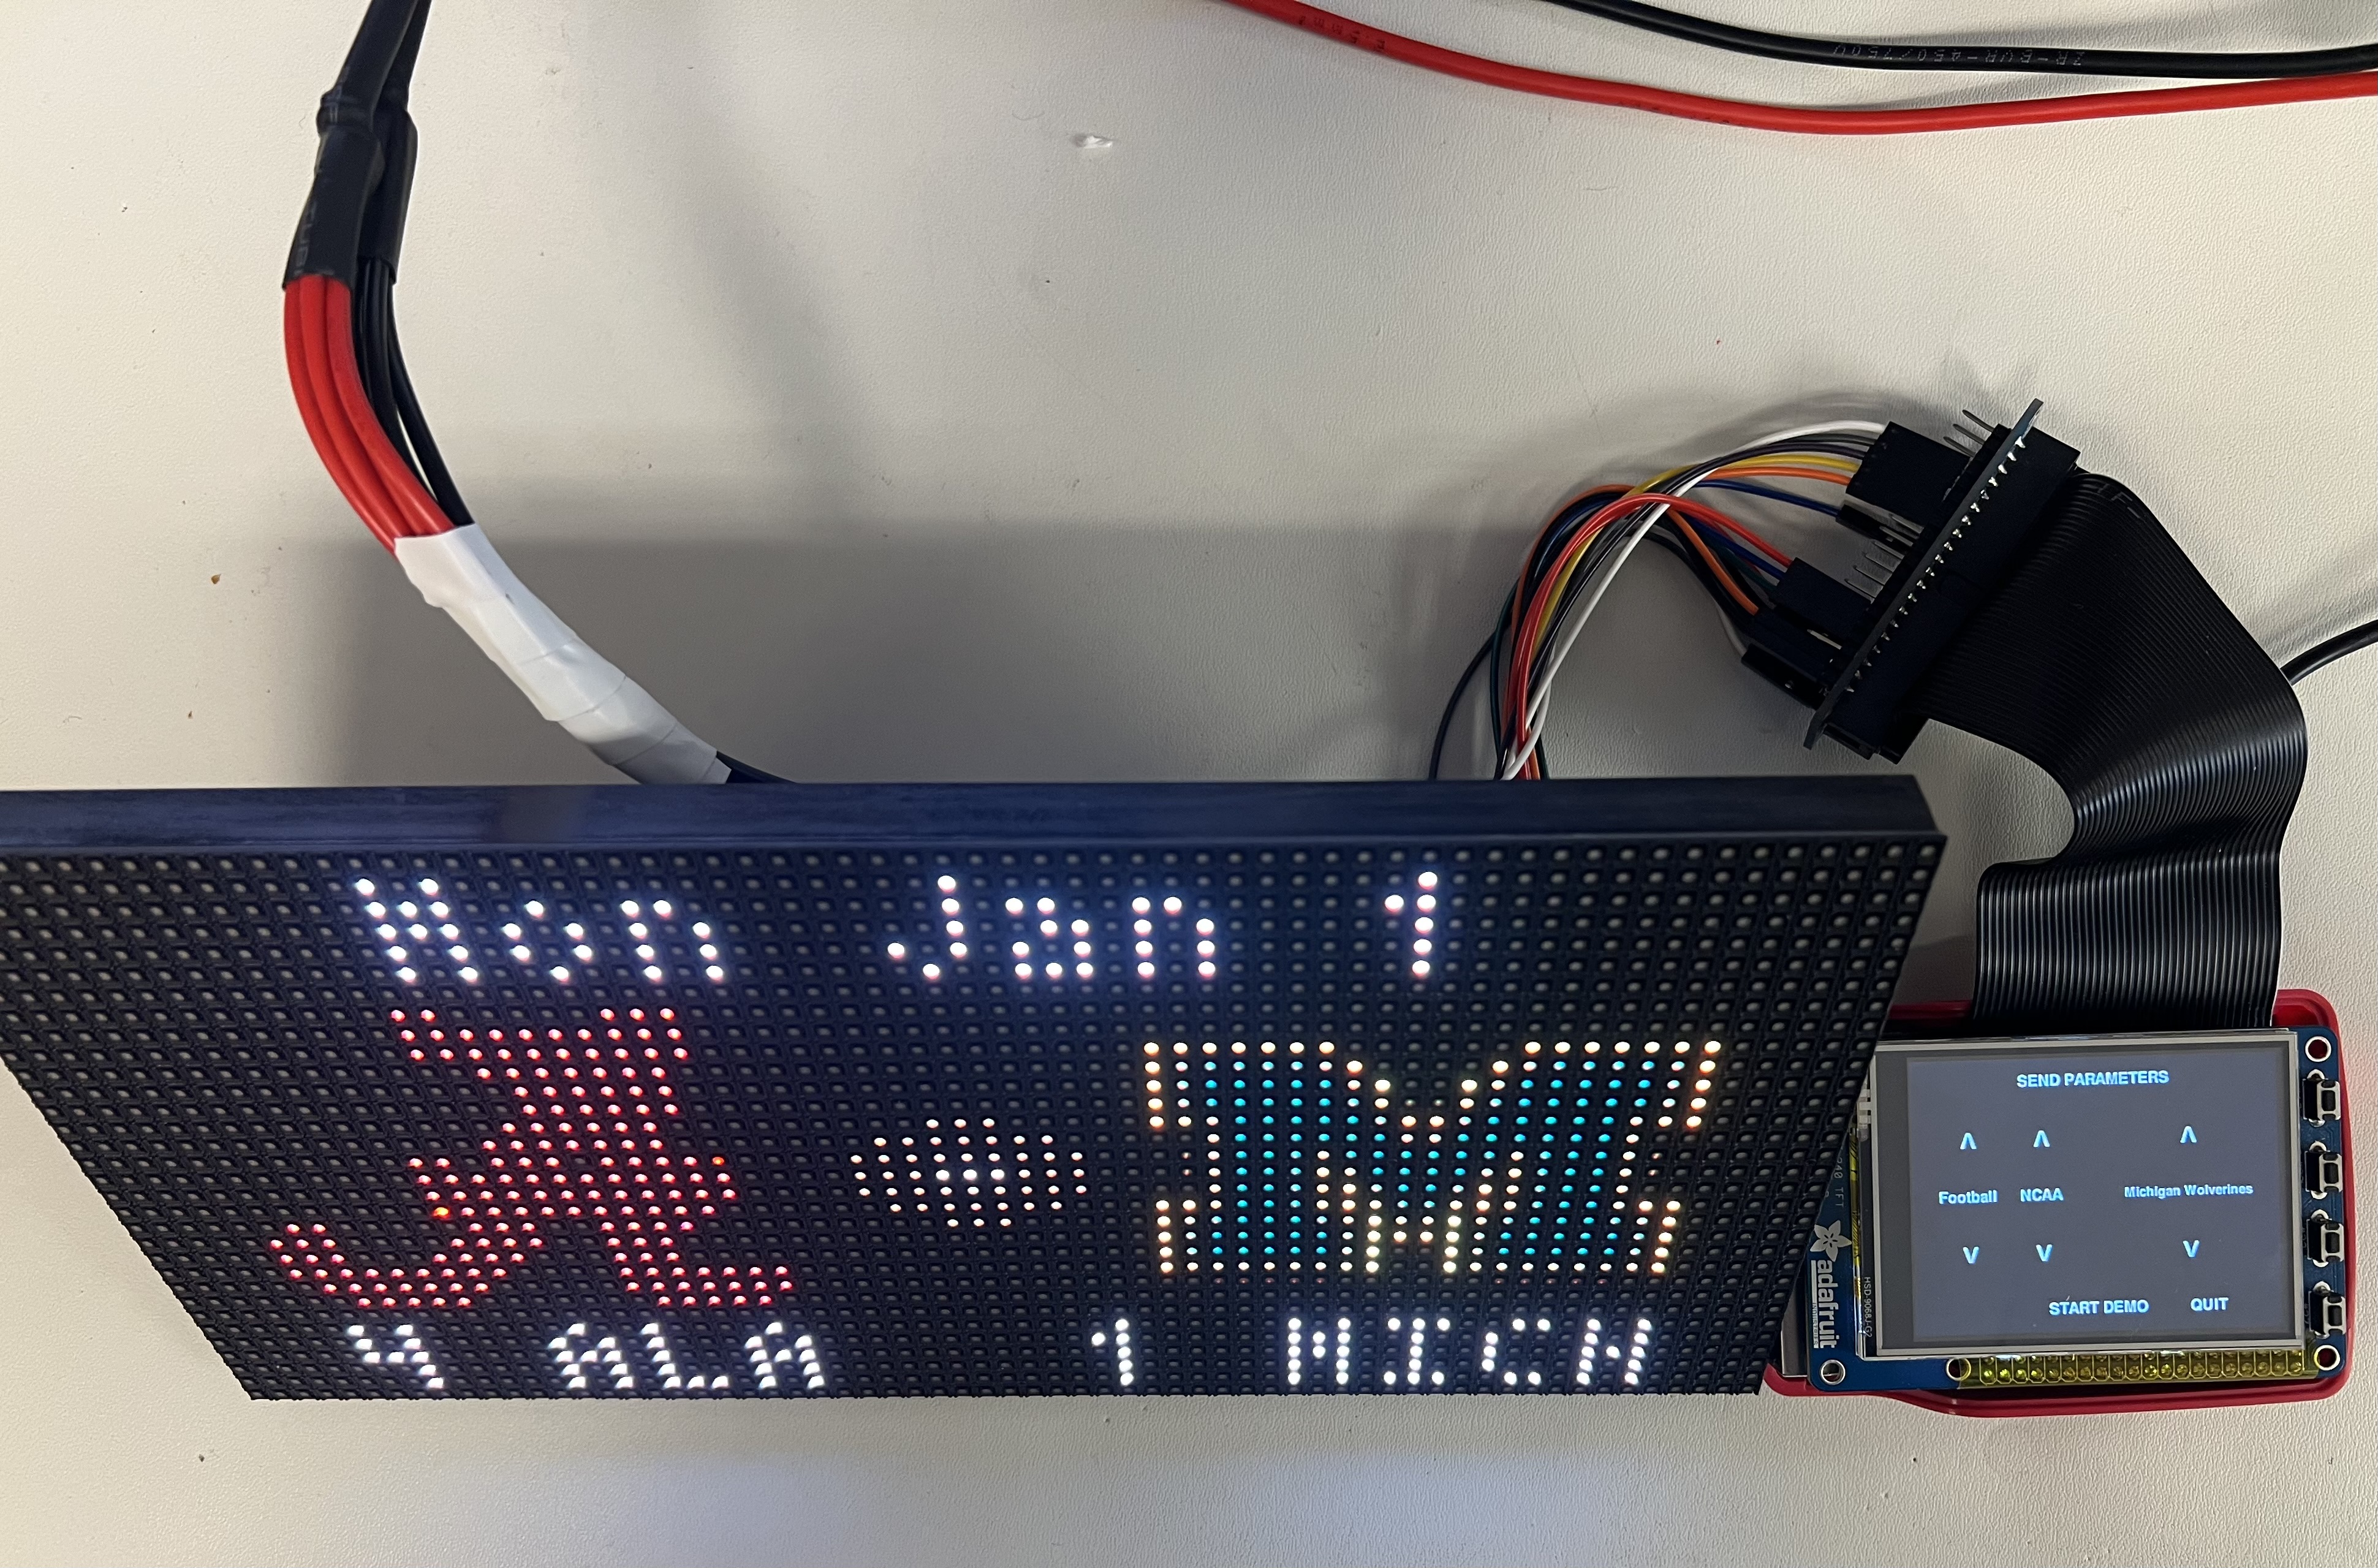
Testing the hardware involved wiring everything up and seeing if the matrix would display simple text. Initially, one source gave incorrect information, saying Pin 12 on the LED matrix should be connected to GND. This wiring is only true for 32x16 LED matrices. For the larger 64x32 matrix, connecting this pin to GND resulted in the bottom half of the matrix being dark and the top half working perfectly. After changing Pin 12 to GPIO 20, this issue was resolved. Figure 2 shows an image of the system after it has been wired correctly.
Figure 2: Final System and Wiring
Software Design and Testing
Installation
The LED Matrix requires one additional Python module called rpi-rgb-led-matrix which
contains
functions to draw text and images on the LED Matrix. To install the tool, download the shell script
from
Adafruit's official GitHub page here
[2]. Once
the script is downloaded, run the script and select "Adafruit RGB Matrix Bonnet" when prompted to
choose
between two different Raspberry Pi Wiring configurations. After rebooting, the packages are
installed and
import rgbmatrix in Python will succeed.
Matrix Object
The Matrix Object, found in matrix.py, is a general class for configuring the LED
matrix. The
class initialization configures the many rgbmatrix options for the specific LED Matrix
that
differ from the library's default values. Rows were set to 32, columns set to 64, and brightness set
to 80.
Finally, rpi-gpio-slowdown, which is used to ensure the fast RPi 4 does not write to
the LED
Matrix too quickly, is set to the maximum slowdown, 4. The initialization of the class also defines
small,
medium, and large fonts as well as black and white colors. After these values are set, the LED
Matrix is ready
to be used. This class also contains some helper functions to be used by the scoreboard to reduce
code
duplication. Resize logo takes an image and
resizes it to a new height. Draw box uses the led matrix draw_line function to draw a
box with
given dimensions and color. Hex to RGB converts hex colors to RGB colors. Invert logo takes an
all-black
image, which cannot be displayed on the Matrix, and converts it to an all-white image. Finally,
ordinal takes
a number, like 1, and converts it to 1st.
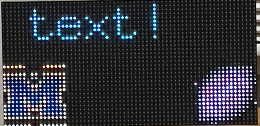
Testing the matrix object involved displaying random text and images in various sizes and colors, as
seen in
Figure 3. At first, the text was
illegible, which was because rpi-gpio-slowdown was not set to slow enough. After
correcting this
mistake, the text could be seen. The text was then drawn in different sizes and colors to test the
various
other functions and fonts. Finally, the Cornell Athletics logo was resized and displayed to ensure
the image
functions were working properly. One issue with resizing images was that there was heavy aliasing
when
downsizing an image to just 20x20. Using the Python Image Library (PIL), the resize image function
was edited
to include Bicubic Interpolation, which created smoother and more visually pleasing imaged on the
tiny LED
Matrix screen. After the Matrix object was complete, it was time to move onto making the actual
Scoreboard.
Figure 3: Testing the Matrix by Displaying Text and Images
The Scoreboard
Parsing Data
The Scoreboard calls the matrix object as a subclass, so it gets initialized with all of the options,
fonts,
colors, and helper functions configured previously. Upon launch, the scoreboard reads the default
values for
sport, league, and team from a configuration file called config.yml. For this project,
these
values were configured respectively to be Hockey, Men's NCAA Hockey, and Cornell Hockey. The
scoreboard
proceeds to send a
HTTP GET request to ESPN's API using the provided values of sport and league. ESPN's API is
unofficial, but
other people have discovered that the format for such an API request is
http://site.api.espn.com/apis/site/v2/sports/{SPORT}/{LEAGUE}/scoreboard [3]. This
project
implements the three sports Hockey, Basketball, and Football for the sport's American professional
league as
well as the men's and women's (where applicable) NCAA league.
The HTTP GET request to the API returns a JSON that must be parsed in order to display the scores on
the
scoreboard. This JSON parsing required lots of testing and trial and error, since the values
returned by the
API were sport-dependent and status dependent. For example, timeouts-remaining is
applicable for
Basketball and Football but not for Hockey. However, if the game is not in progress but instead is
scheduled
or has completed, there is no key in the JSON for timeouts remaining. The strategy used to solve
this issue
was to inject default values for each key that is missing. Then, the JSON can be parsed without
throwing a
KeyNotFoundError and crashing the entire script.
The JSON contains a list of each team in the league's next or most previous competition. The list is
looped
through until the team matches the team given in config.yml. If for some reason that
team is not
present in the list, the first team's competition is instead returned.
Now that the competition has been extracted from the JSON, it can get parsed into custom structs,
which are
found in consts.py. These structs, TeamData and Situation, contain all of
the data
necessary to fully describe the competition. The competition's two teams get parsed into
TeamData, which contains the team's colors, rank, record, logo, 3-4 character
abbreviation, and
score. Situation contains the data about the competition, such as time, period,
possession,
timeouts remaining, last play, and ball location. While not all of these values apply to every
sport, setting
a value to None will cause it to not be inappropriately displayed. Now that all data has been
extracted from
the JSON, it is time to finally display the data on the LED Matrix.
Displaying Data
Data is displayed based on the status of the game which is one of pre-game, in-game, or post-game. If
the
game status is STATUS_SCHEDULED then the game has
not started yet and there are no scores to display. The team logos, abbreviations, ranks, and
records are
displayed
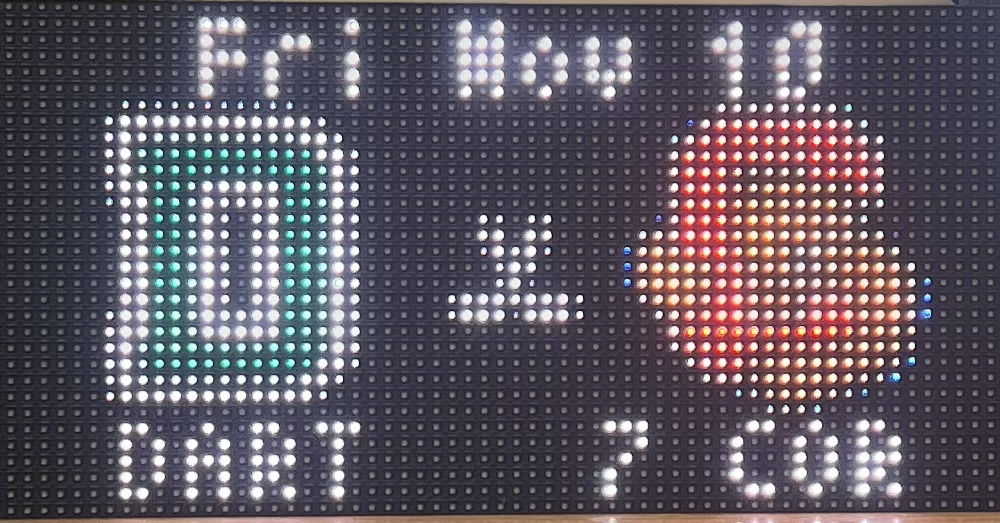
along with the date and time of the event. Not all of this data can fit on the screen at once, as
shown
in Figure 4. Instead, data is cycled through in 8-second periods. The date of the matchup and
the team
abbreviations are shown for 4 seconds, then the time
of the matchup and the team records are shown for 4 seconds. The sport of the game is represented
by either a small football,
basketball, or hockey sticks in the center of the screen.
Figure 4: Pre-Game Display of a Cornell Hockey Matchup
During the game, when status is STATUS_IN_PROGRESS is when the most data is needed to
fully
describe the situation. Therefore, when in-game, the
logos are shrunk to 1/4th the size as they were in pre-game and placed on the right side of the
screen. Boxes
encapsulating the logos, team abbreviations, and scores are drawn according to the team's color.
Timeouts
remaining and possession,
if applicable, are indicated with dashes and dots respectively, just as they are on a real
scoreboard. The
left side of the
screen lists the period and time remaining in the period, as well as the down & yards to go, and
location of
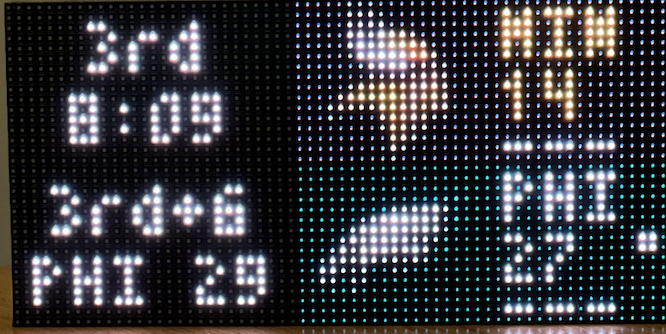
the ball if applicable. Figure 5 shows an in-game Cornell Hockey game and Figure 6
shows an
in-game NFL
game
which therefore also includes down & yards to go, location of the football, timeouts remaining for
each team,
and possession.
Figure 5: In-Game Display of a Cornell Hockey Matchup

Figure 6: In-Game Display of a Professional Football Matchup
When the previous_play field during an in-game Hockey or Football matchup indicates
that points
have been scored, a celebration animation is displayed. The animation displays blinks the name of
the play
(goal,
touchdown, etc.), the name of the team, and a full-screen team logo in 1-second intervals. After 5
blinks, the
animation is over and the score of the game returns. The animation can be seen in Figure 7.
Figure 7: Scoring Animation for Cornell Hockey
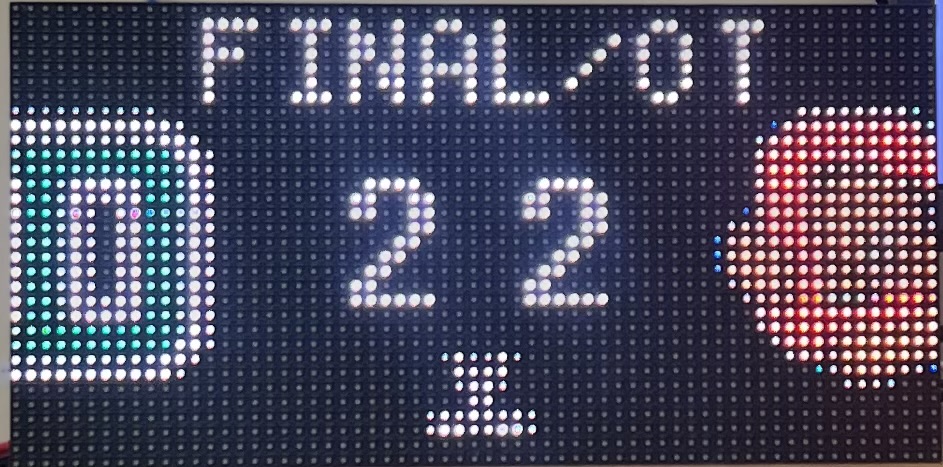
At the end of the game, when status is STATUS_FINAL, the final score must be displayed.
Shown in
Figure 8, the status of the game is seen at the top of the LED Matrix, with the logos in a
similar
position to
the pre-game view. The scores and the sport logo are shown in the center of the screen.
Figure 8: Final Score for Cornell Hockey
To test these various states and display configurations, JSONs were downloaded from the API and
loaded into
the Scoreboard instead of being pulled from the API in real-time. This hack kept all parameters
static so
modes could be tested and verified without changing values. One issue encountered is some team's
colors were
so bright, or white, that when using this color as a background for in-game display, the score could
not be
seen on top of it. The solution was to make a function that decreased the brightness of the
background
rectangle so the text on top could be seen better. Another quick and dirty solution is a
teams_to_invert list in Scoreboard class. Members of this list, such as the Iowa
Hawkeyes, have
either black logos or white team color. After inversion, the team logo is changed to white and the
team color
is changed to black to promote better visibility of the team's logo and score.
Another problem faced occurred when running the system for an extended period of time on RedRover, the firewall started to block the POST requests to ESPN. The solution was to connect the Raspberry Pi to eduroam based on instructions from UCSC engineering [4].
Pygame on the PiTFT
While the scoreboard displays competition data, the PiTFT runs a touch-screen GUI using Pygame to
allow the
user to select
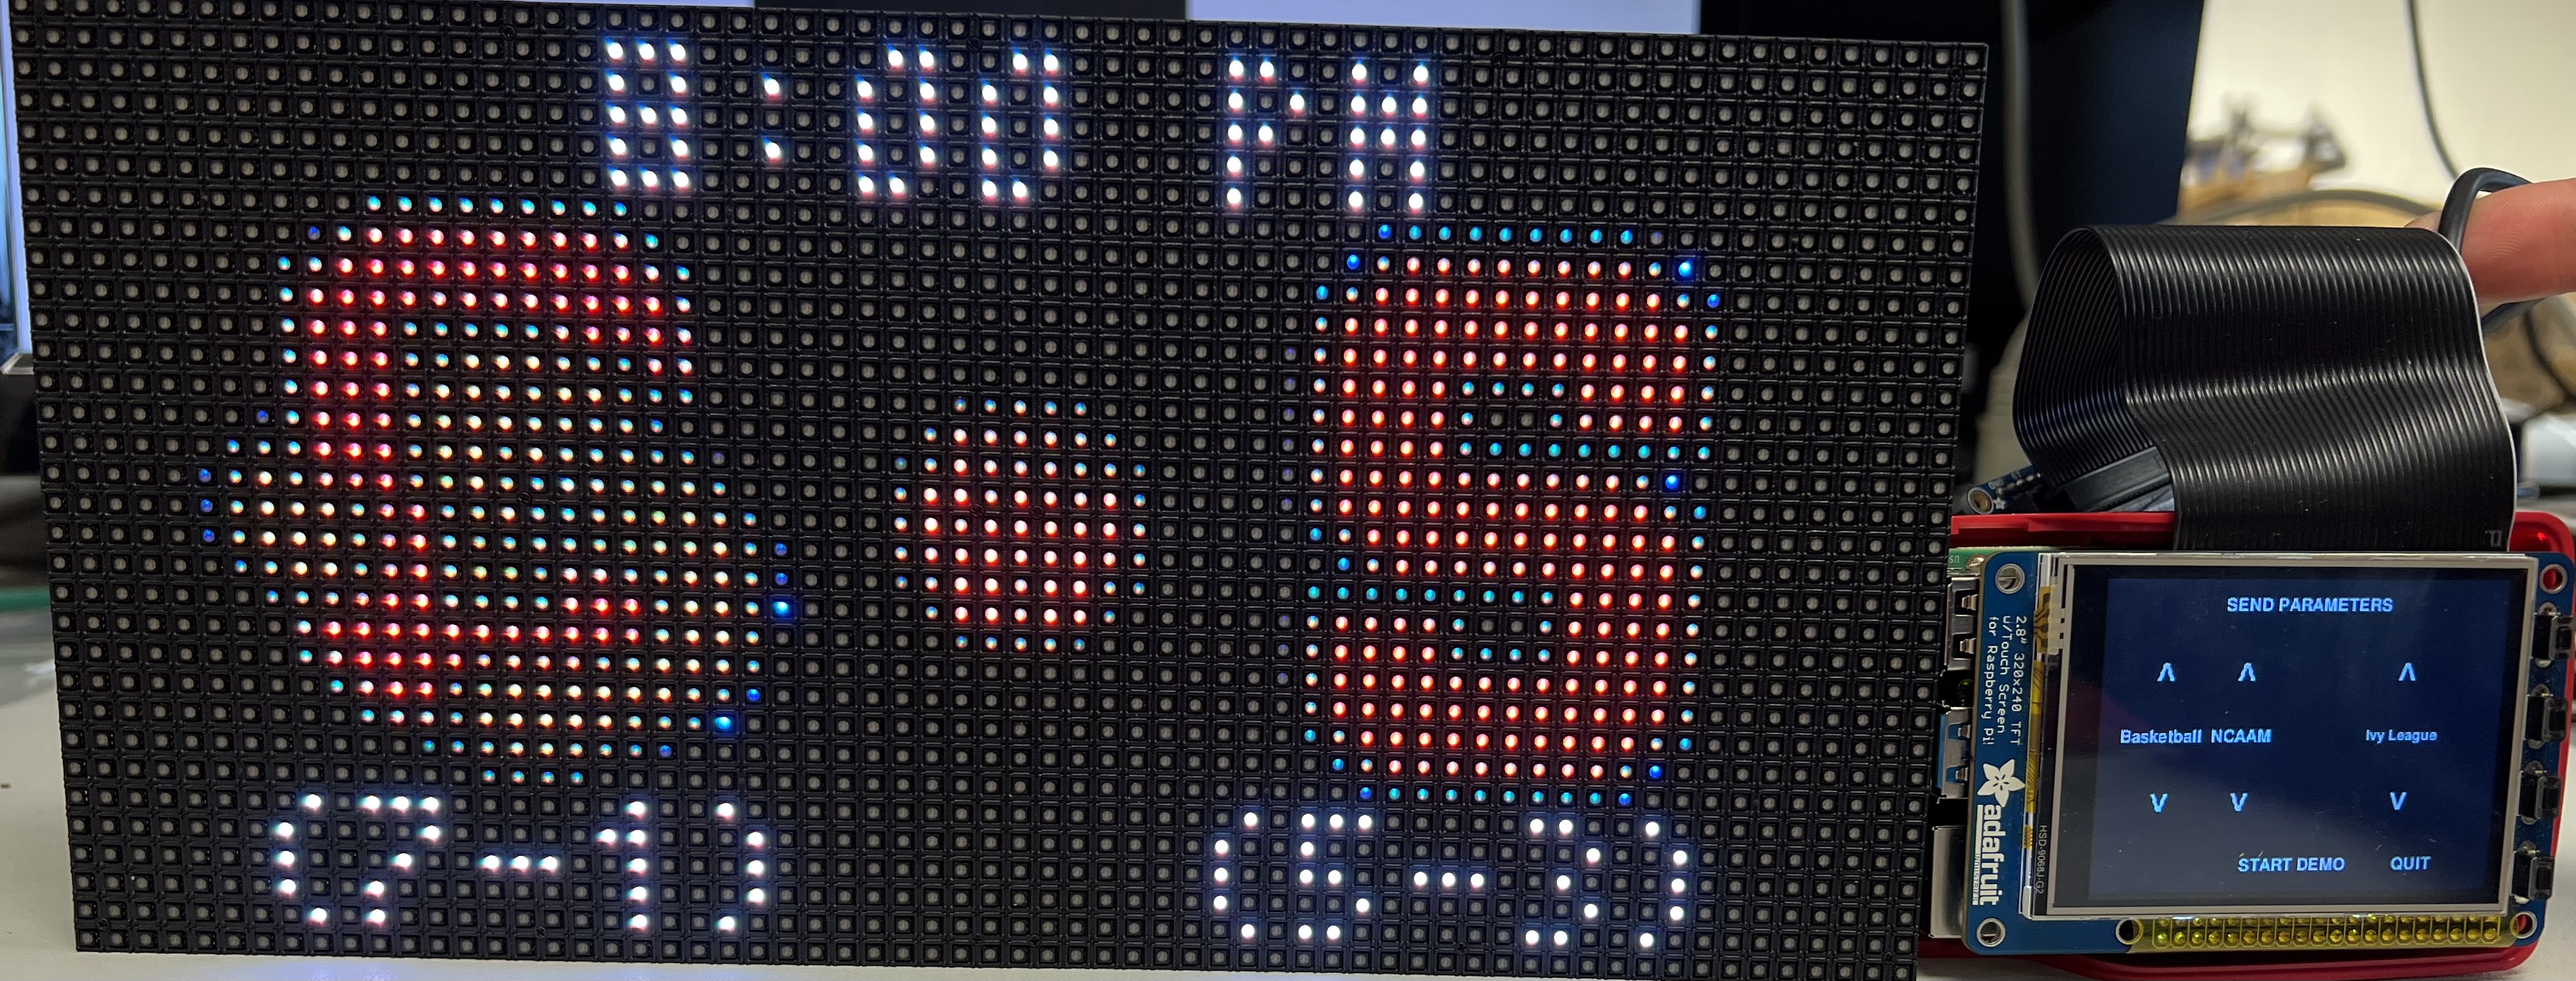
the sport, league, and team to display. Shown in Figure 9, the GUI offers three sets of arrow
keys, one
for each sport, league, and team. The options for league depend on the selection for sport, and the
options
for team depend on the selection for league. When the desired parameters are reached, the
SEND PARAMETERS button is pressed to send the new values to the scoreboard. This button
updates
the global variables that are read by the scoreboard when pulling from the API and selecting a
competition
from the returned JSON.
Figure 9: Touch-Screen PyGame GUI for selecting Sport, League, and Team
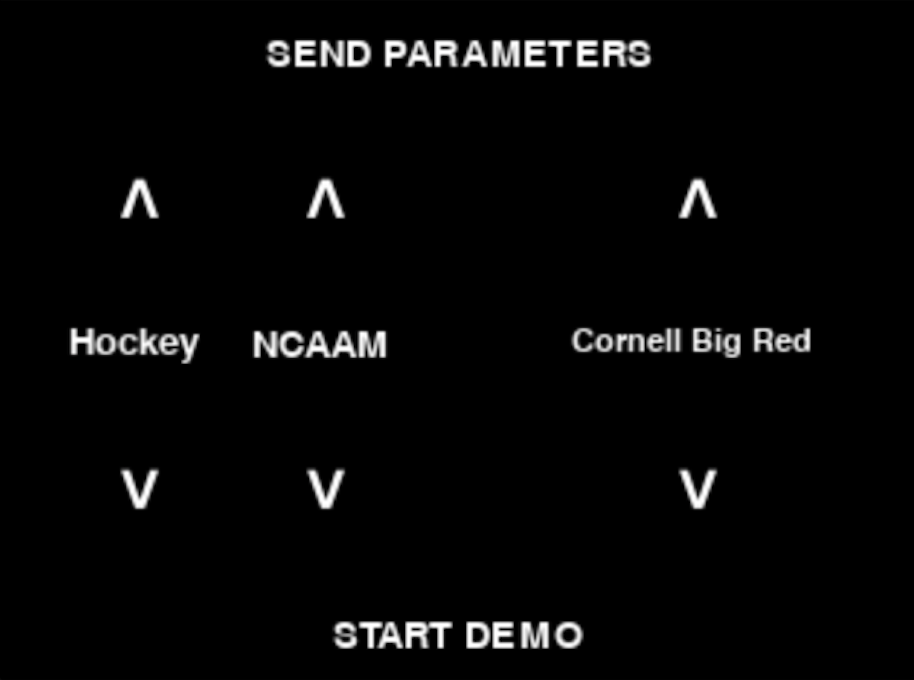
The final button on the GUI, START DEMO, starts the demo. When the button is pushed, a
the global
variable
in_demo is set to True. In this state, instead of querying the ESPN API for new JSONs,
the JSONs
are pulled from the local filesystem. Pulling from the local filesystem to maintain consistency was
used for
previous testing, so the only additional code that had to be done was pull the correct JSON for the
given
state of the demo. The demo intends to highlight the four different phases of a Cornell Hockey game:
pre-game,
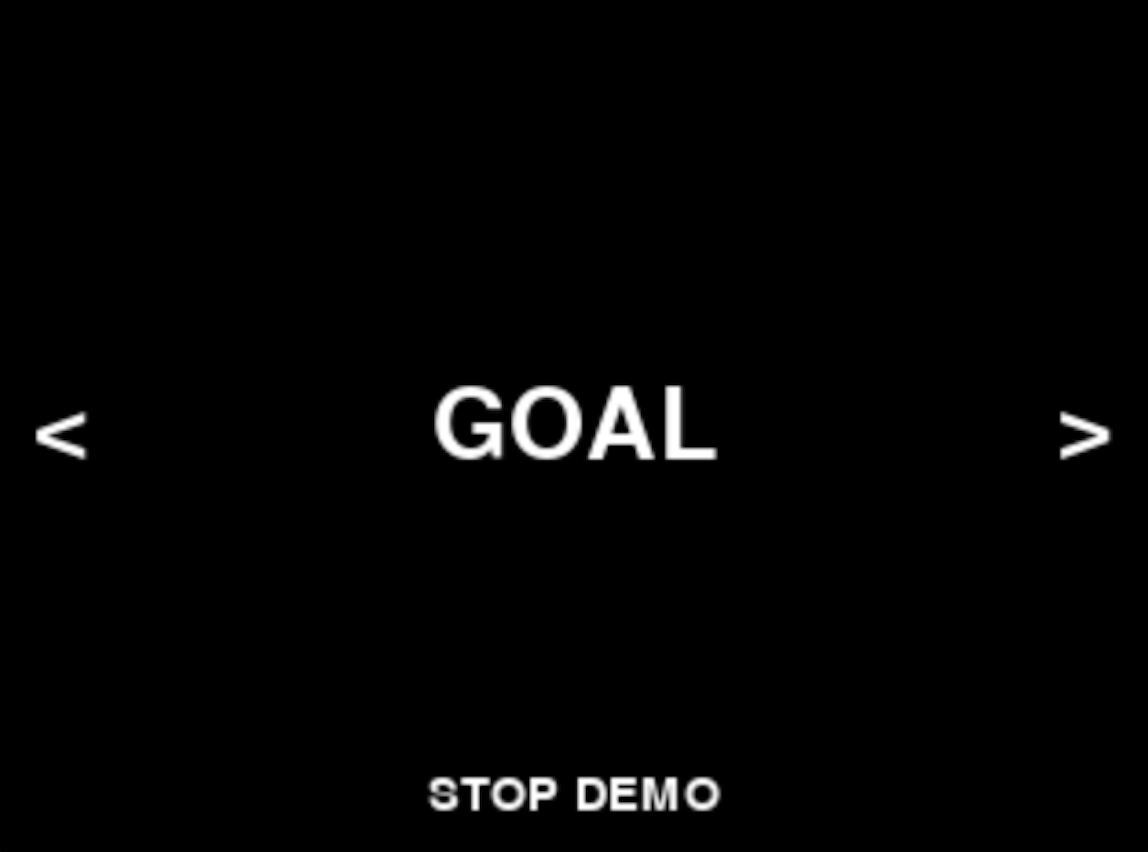
in-game, goal scored, and final. Shown in Figure 10, the user can click back and forth
between states
and go back to live scores by ending the demo when finished.
Figure 10: The System in Demo Mode
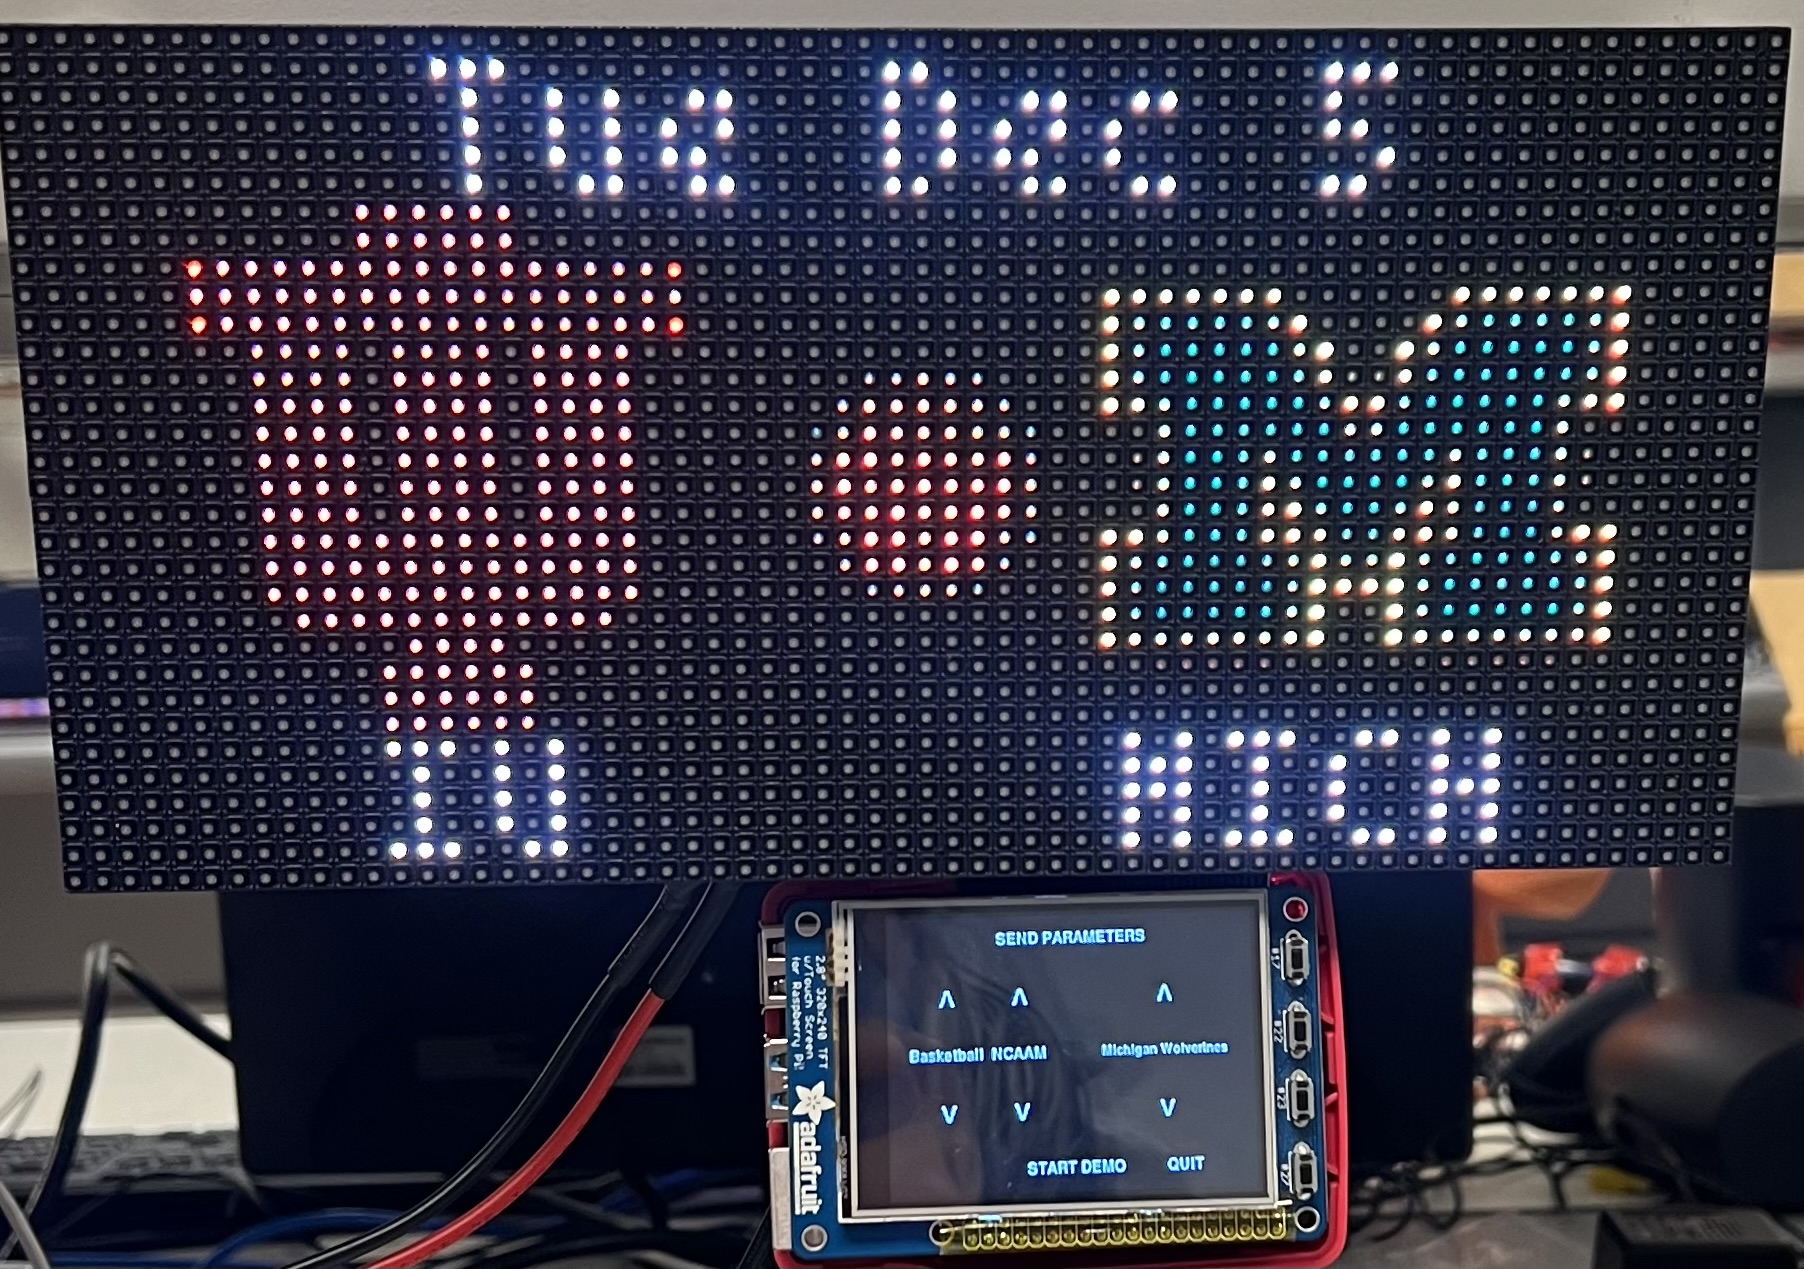
Given a sport and league, the GUI also allows the user to select "All" or a specific league instead of one team. If one of these special options are selected, the scoreboard will display each competition in the pulled JSON for 8 seconds, looping back to the beginning after all matchups have been displayed. Figure 11 shows the system when Ivy League men's basketball has been selected. Each upcoming men's basketball game involving an Ivy League is shown for 8 seconds in a loop.
Figure 11: Rotating Through All Teams in Ivy League Basketball
start.sh and cron
Since this is an embedded system, the scoreboard must start up on boot and not require a keyboard
and mouse to
activate. Using cron, start.sh is called on reboot and starts up the system. The
two-line
start.sh accepts inputs for delay and username, allowing optional arguments for
brightness, size
of the matrix, and rpi-gpio-slowdown. Line 1 delays for the given number of seconds to
allow the
system time to connect to internet before attempting to pull from the ESPN API. Line 2 is a sudo
call to
launch main.py with the given input for username. The intention is to use absolute
filepaths for
both main.py and the fonts used on the matrix, so the user must specify their username
if theirs
is different
than the default value of pi.
Testing is straightforward, just as learned in lecture. By running and confirming
start.sh works
from the /tmp
folder, it can be ensured that start.sh will work from wherever cron runs it from.
Results
As a whole, everything performed as expected and the goals outlined in the initial project description were met. The scoreboard pulls live scores from the ESPN API and displays them on the LED Matrix as planned. The Raspberry Pi, PiTFT, and LED Matrix work together in harmony to provide an embedded system complete with a GUI and plenty of compute and memory to spare.
The scoreboard can transition between the three states of pre-game, in-game, and post-game without the need for human interaction. The demo mode works very well for showcasing the basic features of the system, but definitely could have been improved to showcase other sports or leagues. The extra features implemented, such as displaying other sports besides hockey, rotating through multiple teams, and flashing the team logo when a goal is scored, all served to make the end result even better. The ESPN API along with the 4 second refresh rate provided the perfect amount of delay when watching games. The scoreboard and television were in sync enough that the scoreboard was not spoiling the action by being ahead or unrelated to the action by being too far behind.
There were many bugs experienced when relying on an external API to generate the JSONs needed for displaying data. In leagues such as NCAA Women's Hockey, which is not nearly as popular as the NFL, ESPN is often missing games or details. For these less popular leagues, the pre-game and post-game results may be shown, but ESPN does not show live scores for in-game. Errors were handled very well, allowing top-notch performance and reliability. Default values were assigned when parsing JSONs so the script would never exit. Furthermore, if the user selects a team that is not found in the JSON, the scoreboard will simply display the first competition in the list for the selected sport and league.
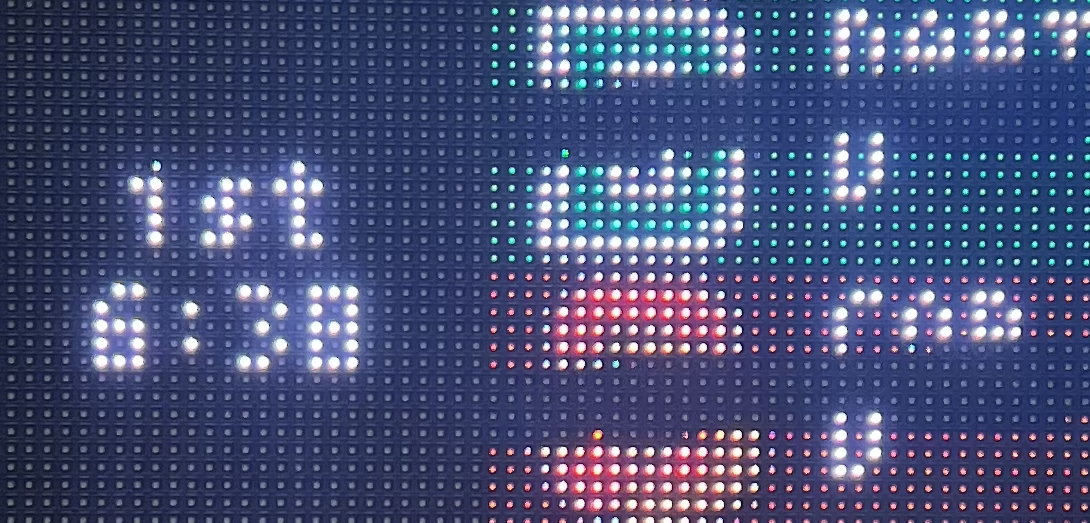
Taking photos of the system was surprisingly difficult. Although impossible to see with the naked eye, the LED Matrix does not light up all LEDs at the same time. As seen in Figure 12, only half of the screen is lit up at any instant. Most pictures taken of the matrix look similar to this, and the only way to take good pictures of the Matrix was to decrease shutter speed for a longer exposure.
Figure 12: Most Photos of the System Have Missing Pixels
Hardware is not my expertise, and mounting/casing was admittedly an afterthought. Fortunately, the LED Matrix came with magnets which were screwed into the back. After taping the PiTFT and Pi in place under the LED Matrix, the entire scoreboard system could be magnetically suspended on any surface. The system is now an all-in-one, portable scoreboard ready to be mounted anywhere, as shown in Figure 13.
Figure 13: System Mounting
Conclusions
The goal of bringing the excitement of an in-person sporting event to the comfort of the home by means of a miniature scoreboard was met. The scoreboard pulls live scores from ESPN API and displays them in real-time to be viewed at a glance. The user can select from over 200 different teams across three different sports with the use of an intuitive touch-screen GUI. The user can also choose to cycle through all teams of a given sport and league or teams in a specific conference. The user can then watch one game on television while keeping up-to-date with other games occurring simultaneously.
At first, a 32x16 LED Matrix was attempted to be used for this project, which has just 1/4 the number of pixels as the 64x32 matrix. The smallest dimensions to make a 26-character alphabet is 4x6 so it only possible to display 8 characters on one line and less than 3 lines of text total [5]. Therefore, it was absolutely necessary to use the larger 64x32 matrix. A higher resolution matrix was considered but did not line up with the goals of this project, which was to bring a retro scoreboard feel to the home environment.
The scoreboard and GUI leverage cron to begin on reboot and function as expected without interruption.
Future Work
This project uses very little computation and memory from the Raspberry Pi 4. One hardware improvement to be made to the system that cuts down on cost is to use a Raspberry Pi Zero W. Continued work could include swapping out the $35 Raspberry Pi 4 for a $15 Raspberry Pi Zero W and verifying the system still works as expected.
One software feature that is nice to include in the future is to allow the user to rotate between a custom list of teams from various leagues. While the system currently allows the user to rotate between different games in a given league, such as rotating through Ivy League Basketball, the system does not allow for customization. The proposed feature allows the user to add teams to a list to be rotated through, such as all sports teams from a given city or university.
Finally, one thing that I wish I had time for is to add a speaker to the system. To more closely mimic in-person sporting events, a siren could go off whenever a goal is scored in hockey, and cheering or the team's anthem could be played whenever a touchdown is scored in football. This feature would require both a hardware and a software addition.
Budget and Bill of Materials
| Item | Quantity | Total Cost ($) |
|---|---|---|
| Raspberry Pi 4 | 1 | 35 |
| 16 GB microSD Card | 1 | 8 |
| 15W USB-C Power Supply | 1 | 8 |
| Resistive Touch PiTFT - 320x240 2.8" TFT+Touchscreen | 1 | 35 |
| 64x32 P4 RGB LED Matrix Panel | 1 | 36 |
| Female DC Power adapter | 1 | 2 |
| 5V 2A DC Power Adapter | 1 | 9 |
| Pin to Socket Jumper Cable | 16 | 2 |
| TOTAL | -- | 135 |
| ECE 5725 Basic Kit (Pi, PiTFT, SD Card, USB-C) | 1 | (86) |
| TOTAL EXCLUDING ECE 5725 BASIC KIT | -- | 49 |
References
[1] Adafruit Industries, "Adafruit RGB Matrix Bonnet for Raspberry Pi," 2023. https://learn.adafruit.com/adafruit-rgb-matrix-bonnet-for-raspberry-pi/?view=all (accessed November 6, 2023).
[2] Adafruit Industries, "Raspberry-Pi-Installer-Scripts," 2023. https://github.com/adafruit/Raspberry-Pi-Installer-Scripts/blob/main/rgb-matrix.sh (accessed November 6, 2023).
[3] A. Easwaran, "ESPN hidden API Docs," 2019. https://gist.github.com/akeaswaran/b48b02f1c94f873c6655e7129910fc3b (accessed November 29, 2023).
[4] Internetworking Research Group — UCSC, "HOWTO Connect Raspberry Pi to Eduroam Wi-Fi," 2019. https://inrg.engineering.ucsc.edu/howto-connect-raspberry-to-eduroam/ (accessed November 10, 2023).
[5] robey, "A very tiny, monospace, bitmap font," 2010. https://robey.lag.net/2010/01/23/tiny-monospace-font.html (accessed December 6, 2023).
[6] Pygame, "pygame v2.6.0 documentation - pygame.display," 2023. https://www.pygame.org/docs/ref/display.html (accessed November 20, 2023)
[7] J. Skovira, “ECE 5725 Lab 3,” 2023. Lab 3_Fall2023_v1.pdf (accessed November 17, 2023).